A randomised controlled clinical trial is the most prevalent design used in Phase II and Phase III clinical trials, whereby participants are randomly assigned to a control or experimental group with a fixed probability, normally 50% for each treatment. This is the gold standard[1] for identifying the best treatment within the trial with a large degree of certainty [2]. If the disease being treated is very common, then a clinical trial could benefit the vast majority of the disease population, such as a 200-person study for cardiovascular disease affecting the lives of the 7 million people who suffer from it in the UK. However, in the case of a rare disease, a trial would involve a larger proportion of the total disease population. For example, cystinosis affects an estimated 660 people in the UK, so a trial with 200 people would contain 30% of all people with said disease. In such cases, the focus may shift to include treating the participants in the trial as effectively as possible.
Distributing treatments to patients equally is ethical if equipoise (the possibility that either treatment could be best [3] )is believed to exist. However, as patients enter the trial, information on both treatments is accumulated, which can often indicate if one treatment is likely to produce a superior outcome. For example, if during the trial it becomes apparent that one treatment is superior, then from a patient’s perspective, they would rather be assigned this predicted ‘superior’ treatment. This is the motivation behind response-adaptive randomisation (RAR) clinical trial designs.
Furthermore, if a treatment has already reached phase III, then much information has been gathered even before the clinical trial begins. Additionally, whether the control treatment is a placebo or SOC, it will have previously been involved in several clinical trials and routinely collected data may also be available. Hence, there will be much information available for the control treatment. Therefore, it is unlikely that equipoise truly exists between the experimental and control treatment before the start of a late phase trial. In this situation, the benefit to patients should be at the forefront of the clinical trial design, and thus, we could use this previous information to influence the treatment allocation probability, to assign more patients to the best treatment.
Fixed Randomisation vs Response Adaptive Randomisation
In a response-adaptive randomised trial, instead of participants being randomly allocated a fixed treatment group, their allocation may change during the trial, and the random probabilities of those allocations may also change according to the response data. Throughout the trial, the data can be continually reviewed, and the treatment allocation probabilities are updated each time [4]. This approach allows more participants to receive the experimental treatment and can be used to find the most efficacious and safe dosage. This can help maximise the number of successful outcomes in patients [5].
Another potential benefit of response-adaptive randomised trials is their potential to tailor treatments to participants based on covariates, as these can affect treatment outcomes. These could include a continuous covariate such as age or weight, a binary covariate like gender, or a categorical covariate such as blood type. Response-adaptive randomised trial designs can include a participant's covariate values in their calculations[6] such that the allocation probability to each arm is influenced by the covariates of the individual patient.
Personalised Medicine
Personalised medicine is a step away from the ʽone-size-fits-allʼ medical approach and instead tailors the treatment to an individual to produce the best response and ensure more effective medical care. Since the 2003 human genome project, human DNA can be mapped out and it is feasible to individualise medicine so that it targets a certain gene. As described by Vogenberg[6], personalised medicine usually targets groups of patients who do not respond well to regular treatment due to certain characteristics such as age, genetics and environmental exposure.
When using a response adaptive clinical trial design, these patient characteristics can be used to allocate patients to a certain treatment. If one treatment is identified as working better for a patient with certain characteristics, then the probability of allocating that treatment to the next person can be adjusted depending on the next patient’s characteristics. This approach leads to improved outcomes for patients included in the clinical trial.
For example, when using response adaptive clinical trial design, if Treatment A is shown to be more effective in patients who are aged < 30 years, then the allocation probability for Treatment A should be larger for a patient who arrives into the clinical trial aged 26 years than for a patient who is aged 40 years. In this way, response adaptive trial designs will allocate more patients to the ʽbestʼ treatment for the individual patient, due to their specific characteristics, than a randomised clinical trial would.
Covariates and Biomarkers
There are multiple trials where the impact of a covariate value on the outcome of a treatment has been shown. These include `Effectiveness of antibiotics for acute sinusitis in real-life medical practice'[7]and `K-ras Mutations and Benefit from Cetuximab in Advanced Colorectal Cancer'[8].
There is a specific type of covariate called a biomarker. A biomarker is defined as ʽa characteristic that is objectively measured and evaluated as an indicator of normal biologic processes, pathogenic processes or pharmacological responses to a specified therapeutic interventionʼ[9]. Biomarkers are further separated into two subgroups: prognostic and predictive.
A prognostic biomarker affects patient outcomes, regardless of which treatment is given. For example, say blood type is a prognostic biomarker for survival. Patients with blood type A have lower survival rates than patients with blood type O, no matter whether either group receives the treatment or the placebo. In contrast, a predictive biomarker affects patient outcomes depending on the treatment given [9]. For example, the presence of a certain gene would be a predictive biomarker if it is associated with higher survival rates under Treatment A, but has no effect on survival rates under Treatment B.
How to incorporate Historic Data
Historic data is currently used to estimate the difference in treatment effect between the control and experimental treatments [10]. This expected difference is then utilised in the sample size calculation to determine the number of patients needed in the clinical trial to ensure a high power ((1−β)=80% is often the aim) and a low type I error (usually chosen to be α=5%). Thus, historic data is already used in the design of clinical trials. Below, we discuss the process of additionally using this historic data to influence and adapt the treatment allocation probability.
Many RAR designs initially start with a burn-in period, where patients are assigned equally to each treatment [11]. As patients enter the trial, information on the treatment outcome is collected and used to adapt the treatment allocation probability, such that the next patients that enter the trial are more likely to be assigned the predicted best treatment. However, if we already have prior information on which treatment is best, this treatment allocation probability can favour the predicted best treatment from the first patient who enters the trial.
There are two ways we can incorporate historic data into a CARA design. Firstly, we can use a Bayesian framework. This would involve using the historic data to develop a prior model for the treatment and then updating this prior model using data from each patient in the current clinical trial to produce a posterior model. For an in-depth summary of Bayesian models see (Bolstad et al 2016) [12]. An alternative design would be to use a weighted regression model. Here, we can use the current and historic patients to predict the treatment outcome together; however, the current patients’ data would be weighted higher than the historic data. Furthermore, a distance measure could be used to test how similar the historic data is to the current data and then the weight assigned to the historic data can be adapted accordingly. For example, if the historic data were a good approximation to the current data, it would be given a large weight, as would the current data. If the historic data were not a good approximation it would be weighted very low, and the current data would still be weighted highly. Below, we investigate the weighted polynomial regression model (for more information see (Moore et al 1997) [13]).
CARA Method
- Use historic data to predict the outcome of patient n for each treatment
- When the next patient, n , enters, measure their baseline covariate value xn, and use xn along with the data from the historic patients to predict the outcome of patient n for both treatments
- Assign the patient to their estimated best treatment with probability πn
- Observe the outcome of patient n and update the estimated outcome of the selected treatment
- Repeat steps 2 to 4 for the rest of the patients in the trial: n + 1, n + 2, ..., N
Distance Measure, Euclidean Distance
(De Maesschalck, et al., 2000) [16] states the Euclidean distance, dE , between two data points p and q, each with Z variables is dE = ![]()
In our method, each historic patient is paired with the current patient who they are most similar to, i.e. the current patient with covariate values, which are closest to the historic patient’s covariate values based on the Euclidean distance (here each current patient can be paired with multiple historic patients). Find the pair with the largest difference in outcome values. That largest difference in outcome values, d , is is taken to be the distance between the two sets of data. The maximum distance which can be found from the two sets of data is noted as dmax. We then weight the historic data points as WH,k = ![]() . We add the squaring function to make the weight assigned to the historic controls smaller. We investigate a linear regression procedure where each historic patient is weighted WH,k =
. We add the squaring function to make the weight assigned to the historic controls smaller. We investigate a linear regression procedure where each historic patient is weighted WH,k = ![]() and each current patient is weighted ‘1’. In this way, no matter how many historic patients are included in the method, the current patients will always be weighted higher.
and each current patient is weighted ‘1’. In this way, no matter how many historic patients are included in the method, the current patients will always be weighted higher.
Here, the probability πn can be chosen based on the confidence you have in the estimate of which treatment is best. For example, you can choose to increase as more patients enter the trial and more information is collected, and hence, the confidence in the prediction of which treatment is best grows. This can produce more successful outcomes than a randomised controlled trial with the same treatments.
Real-world Example
A Phase II/III clinical trial investigated the effect of catumaxomab in the treatment of malignant ascites (ClinicalTrials.gov Identifier: NCT00836654). Malignant ascites are the fluid buildup between a patient's abdominal wall and their organs and is caused by a cancer[14]. This study showed that the treatment of malignant ascites due to different epithelial cancers was improved by the use of catumaxomab plus paracentesis. This treatment prolonged puncture free survival (PuFS) when compared with paracentesis alone (median PuFS: 46 days vs. 11 days, p < 0.0001). In the original study, PuFS was the primary endpoint and overall survival (OS) was a secondary endpoint. The treatment catumaxomab plus paracentesis versus paracentesis alone also showed an improvement in OS; however, the improvement was not statistically significant (median OS: 72 days vs. 68 days, p = 0.0846).
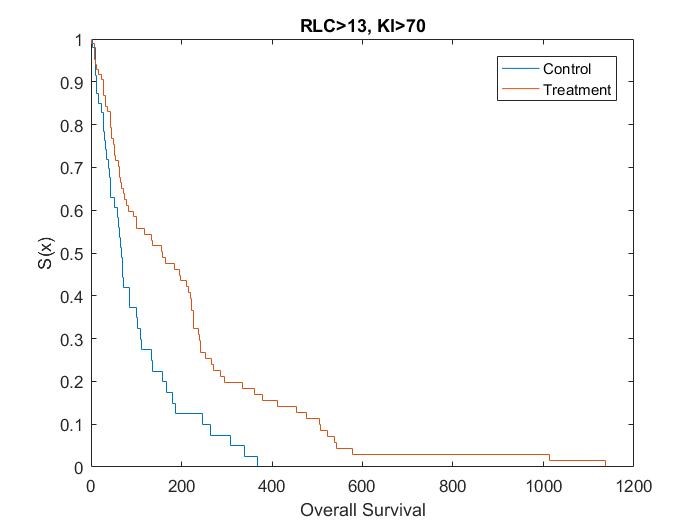
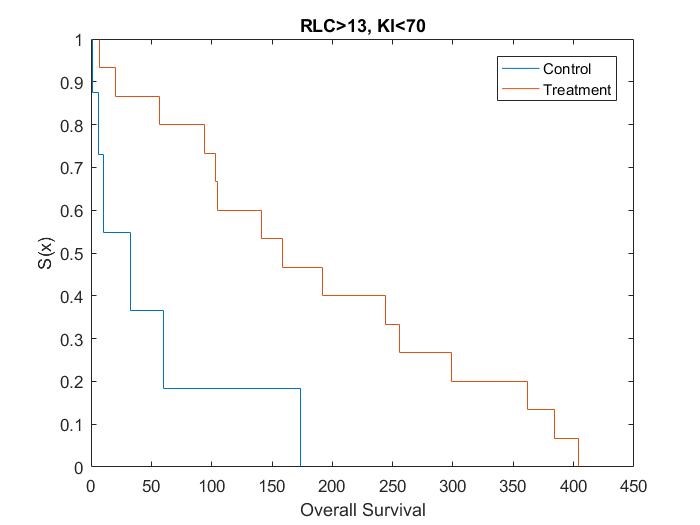
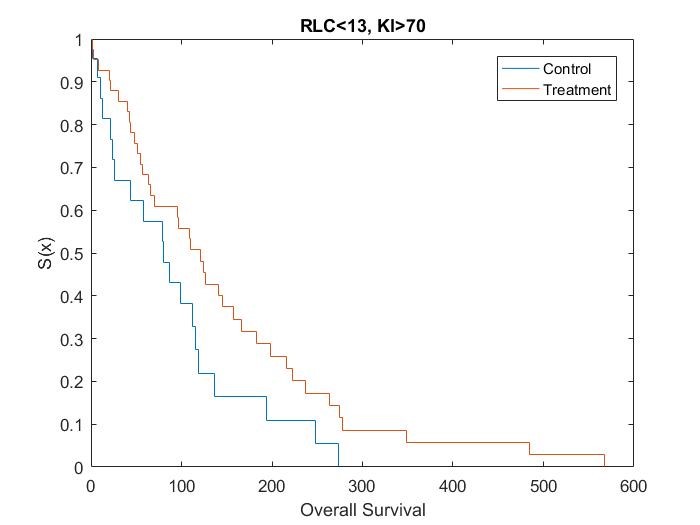
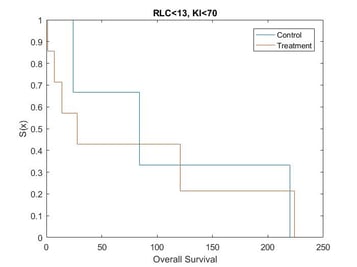
Catumaxomab was further investigated by Heiss[15], in regards to the effect of biomarkers on treatment. Heiss et al performed a posthoc analysis on the impact of several biomarkers, which found that two predictive biomarkers were significant. Patients who had a relative lymphocyte count (RLC) > 13% and a Karnofsky index (KI) ≥ 70% were shown to have an increased OS if given catumaxomab treatment instead of the control treatment, while no treatment effect was observed in the complementary groups.
Kaplan Meier curves for each subset of patients based on simulated data using the results from the posthoc analysis[15] show that the treatment effect varies depending on which subgroup the patient is in (Figure 1, Figure 2, Figure 3 and Figure 4). It can be seen from the plots that the two biomarkers, RLC and KI, are predictive. Therefore; this is a situation where a response-adaptive trial (using a patient’s covariate values to calculate a treatment allocation probability) could be used.
|
Figure 1: Survival Curves for Patient Subgroup 1
|
Figure 2: Survival Curves for Patient Subgroup 2
|
|
Figure 3: Survival Curves for Patient Subgroup 3
|
Figure 4: Survival Curves for Patient Subgroup 4
|
In this scenario, an effective response-adaptive trial design will assign a greater number of patients to the catumaxomab treatment instead of the control treatment if they have RLC > 13% and KI ≥70%, RLC > 13% and KI < 70%, or RLC ≤ 13% and KI ≥ 70%. This is due to the catumaxomab treatment resulting in a greater survival rate than the control treatment for these subgroups of patients. The response-adaptive trial design will also allocate a similar number of patients to the control treatment and the catumaxomab treatment if the patients have RLC ≤ 13% and KI < 70%, as there is a very small difference between the two treatments in this subgroup of patients. The response-adaptive trial design should allocate more patients to their ʽbestʼ treatment, but still allocate enough patients to their lesser treatment to give a good indication of which treatment is best for each subgroup of patients. Thus, the response-adaptive trial design will still produce a high power.
In order to include a method to allocate patients depending on their RLC and KI values, the design of the clinical trial must include some prior information about which covariates are significant and at what value the continuous covariates would be split. Therefore, a response-adaptive trial design would be useful in this situation, but only if it was hypothesised that RLC and KI were significant biomarkers above 13% and 70%, respectively, before the trial began.
The ability to predict response to cancer therapy is an important area of clinical research and there have been many attempts to identify biomarkers that correlate to positive outcomes for a patient[15]. Therefore, identified biomarkers could be used to choose patients who will benefit most from the treatment and, hence, guide treatment decision making for personalised medicine.
Example Scenario
We simulate a clinical trial comparing K = 2 treatments, the control (C) and experimental treatment (E) and their effect on asthma patients. The trial includes N = 40 current patients and we investigate the impact of different proportions of historic patients: NH,k = {0%, 10%, 25%, 50%, 100%} of the current trial size, for each treatment k ∈ {C,E}, using 1,000 simulations. The outcome of interest is ‘forced expiratory volume (FEV) in one second as a percent of predicted’, Yn,k, which is continuous and depends on a patient’s, n , continuous covariate value 'BMI', xn. We assume the outcome can be modelled using an underlying function dependent on their covariate value, summed with a random error term, εn, distributed with zero mean and variance σn, Yn,k = fk (xn) + εn. We assume each patient enters the trial sequentially and we know the outcome of patient n , before n + 1 enters the trial. In addition, assume only patients with a BMI larger than 23 can enter the trial and we model the covariate BMI, xn, using a skewed distribution with mean=27, standard deviation=4.1, skew=1.8 and kurtosis=7. This distribution is displayed in Figure 1, it was chosen to mimic the distribution of BMI in males in the UK in 2007-2009, shown by (Aston, et al., 2013) [17].

The example scenario is shown in Figure 2 below. The solid lines indicate the underlying function for each treatment and the crosses demonstrate the possible outcomes of patients including the addition of the random error term. Here, the experimental treatment (red lines/crosses) is larger than the control treatment (blue lines/crosses) for all covariate values, on average. However, due to the random error term some patient’s individual best treatment may actually be the control treatment (here, the random error term increases as the FEV outcome increases). This is more likely for patients with large covariate values, where the difference in average outcome is smaller. This scenario shows a decrease in FEV in one second as the BMI of the patient increases. This decrease is larger for the experimental treatment. This scenario was chosen, as (Stenius-Aarniala, et al., 2000) [18] shows a larger BMI might be linked to a lower FEV value. In this scenario, we assume the FEV outcome is bounded between 40% and 100%.

Results
Historic Data available on both treatments

As one would expect, as more historic data is made available the proportion of current patients assigned the best treatment increases. This increase is steep as the amount of historic data initially increases, however, as the amount of historic data increases from 25% to 50%, the proportion of patients assigned the best treatment tends to plateau. This is because additional historic data does not increase the accuracy of predicting which treatment is best, 25% historic data points seems to be enough to produce an accurate prediction in this situation. This is true for both proportion of patients assigned the best treatment on average and the proportion of patients assigned their individual best treatment. It is also always larger than 50%, which is the proportion of patients who would have been assigned the best treatment if an equal allocation RCT were used (shown by the green solid line and circles). This is true, even when no historic data is included, therefore, the CARA design learns which treatment is best within the trial.
Historic Data available on one treatment

When historic data is only available on one treatment, we initially use a non-informative prediction of for all covariate values (as this is the mean outcome for the control treatment over all covariate values), when predicting the outcome of a patient on the other treatment. As this non-informative prediction is the mean of the true underlying function of the control treatment, it does very well when there are only historic data available on the experimental treatment. Figure 4 shows an increase in proportion of patients given the best treatment as the amount of historic data increases. Furthermore, it even produces larger proportions of patients on the best treatment than when historic data is available on both treatments. This is due to the initial prediction of 65 on the control treatment, being much smaller than the predicted outcome using the historic data on the experimental treatment for patients with small covariate values. Hence, the method will predict the experimental treatment as ‘superior’ often, for these small covariate values. It is at the covariate value of roughly xn = 47, when the initial prediction of 65 on on the control treatment becomes larger than the underlying function on the experimental treatment. However, patients with these large covariate values are uncommon, thus, the increase in patients with smaller covariate values being assigned the experimental treatment correctly, is larger than the decrease in patients with large covariate values being assigned the control treatment incorrectly, when compared with historic data being available for both treatments.
However, having historic data on the control treatment only causes a decrease in proportion of patients given the best treatment. Here, increasing the proportion of historic data decreases the proportion of patients given the best treatment. This is likely due to the non-informative prediction of 65 not being a good approximation to the outcome produced by the experimental treatment. As the control treatment produces outcomes above for small covariate values, the method is likely to assign patients with small covariate values initially to the control treatment, who will also produce outcomes larger than 65. Hence, more patients who arrive into the trial with small covariates are likely to continue to be allocated the control treatment, incorrectly. It is at the covariate value of roughly xn = 39, when the initial prediction of 65 on the experimental treatment becomes larger than the underlying function on the control treatment. So patients with covariate values above xn = 39, can then be allocated the experimental treatment, correctly. However, patients with these covariate values are unlikely to enter the trial and therefore, the method is highly likely to get ‘stuck’ on the control treatment and keep assigning patients to it, incorrectly. Furthermore, we see when there is only historic data available on the control treatment, fewer patients are being assigned the best treatment than the equal allocation RCT design. Here, the addition of historic data has massively hindered the CARA design.
Conclusions
We have demonstrated that historic data can be incorporated into a CARA design and in some situations will assign more patients to the best treatment than the equal allocation RCT. When there is historic data available on both treatments, the more historic data the better, up to a point. In this situation, having 50% or 100% historic patients gives very similar results to having 25% historic patients.
However, when historic data is only available on one arm, how well the method performs depends on the accuracy of the initial non-informative prediction on the other arm. When this initial non-informative prediction is not a good approximation of the truth, one must be very careful, as the addition of more historic patients can actually hinder the method. For more information on how historic patients can be included in clinical trial designs see: (Viele, et al., 2014) [19] and (Ghadessi, et al., 2020) [20].
Quanticate's statistical consultants are among the leaders in their respective areas enabling the client to have the ability to choose expertise from a range of consultants to match their needs. Our team would be happy to provide support and guidance for your Adaptive Trial Design. If you have a need for these types of services please Submit a RFI and member of our Business Development team will be in touch with you shortly.
References
[1] Hariton Eduardo and Locascio Joseph J Randomised controlled trials—the gold standard for effectiveness research [Journal] // BJOG: an international journal of obstetrics and gynaecology. - [s.l.] : NIH Public Access, 2018. - 13 : Vol. 125.
[2] Williamson Faye S [et al.] A Bayesian adaptive design for clinical trials in rare diseases [Journal] // Computational statistics \& data analysis. - [s.l.] : Elsevier, 2017. - Vol. 113. - pp. 136—153
[3] Miller Franklin G and Joffe Steven Equipoise and the dilemma of randomized clinical trials. [Journal] // The New England journal of medicine. - 2011. - 5 : Vol. 364. - pp. 476-480.
[4] Villar Sofia S, Bowden Jack and Wason James. Multi-armed bandit models for the optimal design [Journal] // Statistical science: a review journal of thes. - [s.l.] : Statistical science: a review journal of the Institute of Mathematical Statistics, 2015. - Vol. 30. - p. 199.
[5] Cheung, Y. (2006). Continuous Bayesian adaptive randomization based on event times with covariates. Statistics in Medicine, 55-70.
[6] Villar Sofia S and Rosenberger William F. Covariate-adjusted response-adaptive randomization for [Journal] // Biometrics. - [s.l.] : Statistics in Medicine, 2018. - Vol. 74. - pp. 49-57.
[6] Vogenberg, F. R. (2010). Personalized medicine: part 1: evolution and development into theranostics. . Pharmacy and therapeutics, 560.
[7] Blin Patrick [et al.]. Effectiveness of antibiotics for acute sinusitis in real-life medical practice [Journal] // British Journal of clinical Pharmacology. - [s.l.] : British journal of clinical pharmacology, 2010. - Vol. 70. - pp. 418-428.
[8] Karapetis Christos [et al.]. K-ras Mutations and Benefit from Cetuximab in Advanced Colorectal Cancer [Journal] // The New England Journal of Medicine. - [s.l.] : The New England Journal of Medicine, 2008. - Vol. 359. - pp. 1757-1765.
[9] Oldenhuis C N. A. M. [et al.]. Prognostic versus predictive value of biomarkers in oncology [Journal]. - [s.l.] : European journal of cancer, 2008. - 7 : Vol. 44.
[10] Li Wen, Liu Frank and Snavely Duane Revisit of test-then-pool methods and some practical considerations [Journal] // Pharmaceutical statistics. - [s.l.] : Wiley Online Library, 2020. - 5 : Vol. 19. - pp. 498--517.
[11] Thorlund Kristian [et al.] Key design considerations for adaptive clinical trials: a primer for clinicians [Journal] // bmj. - [s.l.] : British Medical Journal Publishing Group, 2018. - Vol. 360.
[12] Bolstad William M and Curran James M Introduction to Bayesian statistics [Book]. - [s.l.] : John Wiley \& Sons, 2016.
[13] Moore Andrew W, Schneider Je and Deng Kan Efficient locally weighted polynomial regression predictions [Book Section] // Proceedings of the 1997 International Machine Learning Conference. Morgan Kaufmann. - 1997.
[14] Becker Gerhild, Galandi Daniel and Blum Hubert E. Malignant ascites: Systematic review and guideline for treatment [Journal] // European Journal of Cancer. - [s.l.] : European Journal of Cancer, 2006. - Vol. 42. - pp. 589-597.
[15] Heiss Markus M [et al.]. The Role of Relative Lymphocyte Count as a Biomarker for [Journal] // Clinical Cancer Research. - [s.l.] : Clinical Cancer Research, 2014. - Vol. 20. - pp. 3348-3357.
[16] De Maesschalck Roy, Jouan-Rimbaud Delphine and Massart Desire L The mahalanobis distance [Journal] // Chemometrics and intelligent laboratory systems. - [s.l.] : Elsevier, 2000. - 1 : Vol. 50.
[17] Aston Louise and Kroese Mark Genomics of Obesity [Journal]. - 2013.
[18] Stenius-Aarniala Brita [et al.] Immediate and long term effects of weight reduction in obese people with asthma: randomised controlled study [Journal] // Bmj. - [s.l.] : British Medical Journal Publishing Group, 2000. - 7238 : Vol. 320. - pp. 827--832.
[19] Viele Kert [et al.] Use of historic control data for assessing treatment effects in clinical trials} [Journal] // Pharmaceutical statistics. - [s.l.] : Wiley Online Library, 2014. - 1 : Vol. 13. - pp. 41--54.
[20] Ghadessi Mercedeh [et al.] A roadmap to using historic controls in clinical trials--by Drug Information Association Adaptive Design Scientific Working Group (DIA-ADSWG) [Journal] // Orphanet journal of rare diseases. - [s.l.] : BioMed Central, 2020. - 1 : Vol. 15. - pp. 1--19.
